Mountain Car
Run this example at https://github.com/Trustworthy-AI/test-environments.
Mountain Car
Background
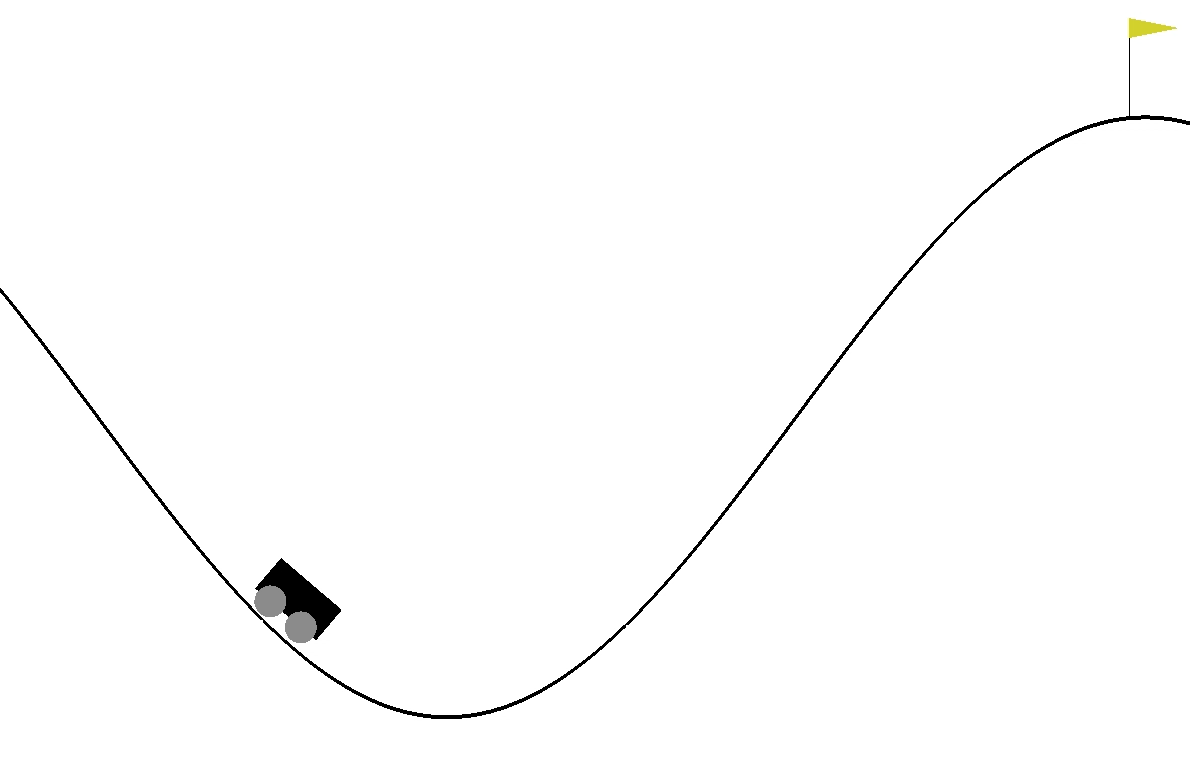
We consider a minimal reinforcement learning task, the MountainCar problem. In the paper, Verisig: Verifying safety properties of hybrid systems with neural network controllers, Ivanov et al created a formally-verified neural network controller to achieve reward \(> 90\) over all initial positions \(\in [-0.59, -0.4]\) and 0 initial velocity. The guarantees of formal verification hold only with respect to the specified domain; even small domain perturbations can affect system performance. We illustrate this sensitivity by adding a small perturbation to the initial velocity \(\sim \mathcal{N}(0, 10^{-4})\) and seek \(p_{\gamma}:= \mathbb{P}_0(\mathrm{reward} \le 90)\) for \(\mathbb{P}_0\!=\!\mathrm{Unif}(-0.59, -0.4)\! \times\!\mathcal{N}(0, 10^{-4})\). We measure the ground-truth failure rate as \(p_{\gamma}=1.6 \cdot 10^{-5}\) using 50 million naive Monte Carlo samples.
The following figure shows contours of \(f(x)\).
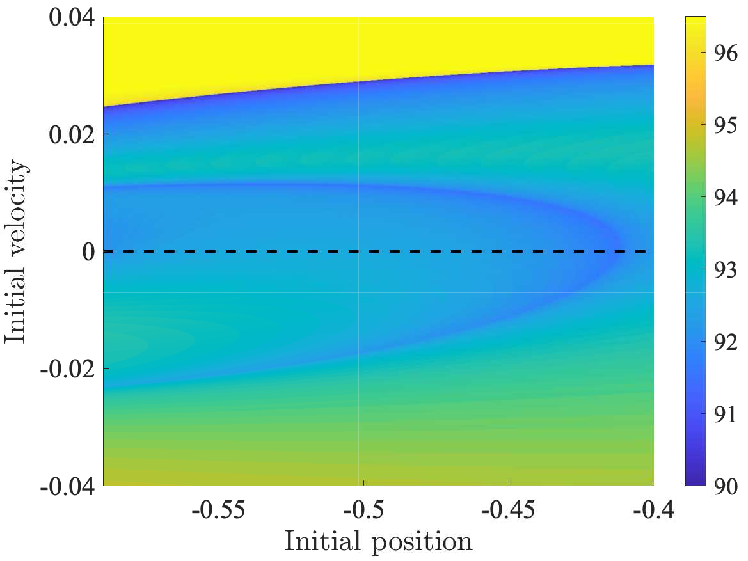
Notably, the failure region (dark blue) is an extremely irregular geometry with pathological curvature, which renders MCMC difficult for many methods making this a useful benchmark despite being low dimensional.
Implementation Details
We have implemented a module in Python that simulates the Mountain Car scenario and have integrated it with the TrustworthySearch API. The intent is for our API to discover states of initial position and initial velocity where the neural network trained policy is not able to "reach the flag" (where reward is \(< 90\)).
We create a class called TorchMountainCarEnv to represent the Mountain Car environment, which consists of the agent policy and functions to simulate the policy in the environment given an initial position and an initial velocity, which we call the initial state, \(x\). The simulation returns information about the agent's reward, \(r\), which we can use to determine if the agent reached the flag in the simulation.
The sections below detail the environment class, and describe how we can easily integrate such an environment into the TrustworthySearch API.
MountainCar Module
The MountainCar module located in the test-environments/mountaincar/MountainCar directory contains the script, TorchMountainCar.py.
TorchMountainCar.py
TorchMountainCar.py contains a class called TorchMountainCarEnv which represents the Mountain Car environment. This is the environment that we integrate with the TrustworthySearch API.
The class contains functions to simulate the policy's actions in the MountainCar environment, and obtain a reward after a set number of iterations.
Policy
TorchMountainCarEnv contains an agent which is a deep neural network. The neural network from the Verisig paper is a two-hidden-layer sigmoid-based deep neural network with 16 neurons per layer. The last layer employs a tanh activation function in order to scale the output to be between -1 and 1.
Objective Function
In the same TorchMountainCar.py script, we implement a function called compute_obj_grad that calculates the overall reward and its gradient with respect to the initial conditions that the Mountain Car achieves. Note that a gradient is not required to use TrustworthySearch. The input is a batch of initial states, \(X\), of shape (batch_size, 2). We obtain 2 from the number of dimensions of the input state, which in the case of MountainCar is an initial position and an initial velocity in the environment. This is the objective function that we will use when integrating with the TrustworthySearch API.
'''
`TorchMountainCar.py`, lines 193-218
This function returns the reward and the grads for a set of params
with an expected shape of (batch_size, dimension)
'''
def compute_obj_grad(params, env):
    torch.manual_seed(123)

    position = torch.from_numpy(params[:,0]) # (batch_size, 1)
    velocity = torch.from_numpy(params[:,1]) # (batch_size, 1)

    position.requires_grad_(True)
    velocity.requires_grad_(True)

    # perform simulation on environment
    out = env.torch_while_loop(torch.stack([position, velocity], axis=1))
    reward = out[2]
    sum_out = torch.sum(reward)

    # compute gradients
    sum_out.backward()
    dp = position.grad
    dv = velocity.grad

    with torch.no_grad():
        reward_np = reward.numpy().astype(np.float64) # (batch_size,)
        grad_np = np.stack([dp,dv], axis=1).astype(np.float64) # (batch_size, 2)

    return reward_np, grad_np
Your objective function must satisfy the following requirements:
- Input
paramsof shape(batch_size, dimension). - Output (reward/result of simulation) of shape
(batch_size,)with adtype=np.float64.
Other inputs or outputs may be added, but the requirements described above must be satisfied by your objective function.
TrustworthySearch API
Below we detail the exact changes in code that must be made in order to integrate the MountainCar environment with TrustworthySearch API.
Only two files must be edited, worker.py and broker.py.
Worker
In the directory test-environments/mountaincar/tsclient, find file worker.py.
The purpose of worker.py is to run local workers for the Trustworthy API service. The details of the worker's simulation function and evaluation are specified in runWorkerScript.py for each sample environment.
Broker
In the directory test-environments/mountaincar/tsclient, find file broker.py. The broker manages the TrustworthySearch job and feeds the workers batches of simulations to evaluate. The broker is run via the file runBrokerScript.py. The details of jobs for each example environment are specified in a dictionary. For the Mountain Car environment:
param_dict_mcar = {'dist_types': [ts.Distribution.GAUSSIAN] * 2,
                   'job_mode': ts.JobStyle.Mode.MINIMIZE,
                   'dimension': 2,
                   }
Depending on the properties of the environment, these parameter values will change. You only have to change dimension, dist_types and job_mode. The other parameters can be specified as arguments when running the broker.py script.
In this example, we add the following specifications based on the MountainCar environment:
dimension=2
Only 2 values to describe input state: (initial_position, initial_velocity)
dist_types=[ts.Distribution.GAUSSIAN] * 2
When sampling for an input state, use a Gaussian distribution for both the initial_position and the initial_velocity. The 2 is equal to the value of the dimension parameter. This creates a list of two Gaussian distributions, one for each dimension.
job_mode=ts.JobStyle.Mode.MINIMIZE
In this use case, the task is to find states in which the reward is minimized, since the lower the reward, the more of a failure it is. The adaptive algorithms will therefore aim to find discover initial states where the reward is lower.
Visualizations
After adapting the broker and workers to fit the needs of this project, we ran a RISK job with the following arguments:
threshold=90
Any result from the objective function less than this threshold value will be considered a failure by the TrustworthySearch API. (In this case, it is 'less than' because we specify the job_mode to MINIMIZE.)
stop_prob=1e-5
The smaller the stop probability, the longer the task will run.
stop_prob_confidence=0.9
The higher the stop probability confidence, the longer the task will run.
We collected the results to create visualizations of the parameters that made the simulation fail (e.g. the mountain car was unable to reach the flag). The number of evaluations was calculated to be about 95000.
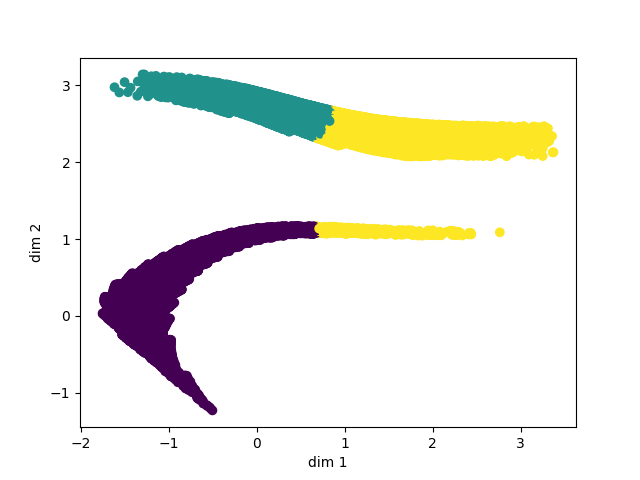
In order to best visualize the resulting parameters returned to us from this job, we employed the silhouette method to find the optimal number of clusters for the data. The silhouette score used to evaluate each clustering is undefined when there is only 1 cluster, so to account for this case we used a heuristic saying if the max score is very bad (specifically below .4 as 1 is the max score indicating perfect fit and -1 is the lowest score) then that means the data is most likely in one big cluster. Additionally, we iteratively changed the cluster centers based on the points that had the smallest mahalanobis distance to them in order to improve the visualization. The parameters for the visualization are as follows:
- Threshold below which points are plotted = 92
- Max Number of Clusters Considered = 50
- Number of Iterations for Updating Centers = 30
- Error Tolerance for Early Stopping of Iterations for Updating Centers = .05
- Max silhouette_score to consider 1 cluster < .4
Below is the data clustered using the above method:
Additionally, it is useful to see at what probabilities the objective goes beyond a certain threshold, so we also created a plot of log-scale probabilites versus thresholds along with error bars. Below is an example of such a plot made from this data:
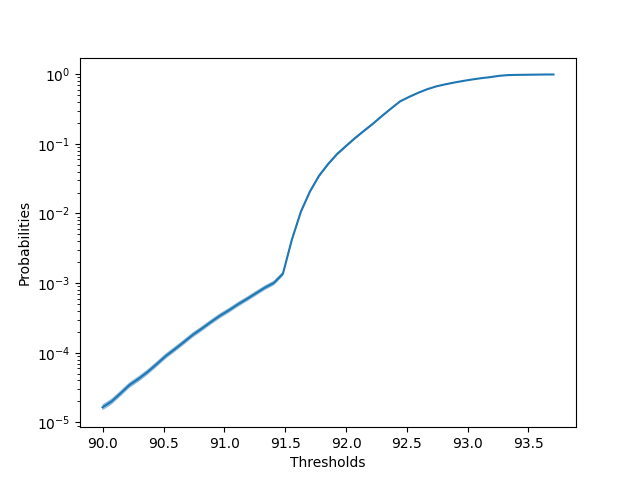
These visualizations should help the user understand more deeply under which conditions their job is failing.